It's time for some ASCII art with the TIS-100!
Segment 50370: image test pattern 1
Here we are introduced to the fine graphics capabilities of the TIS-100. This first puzzle is basically a tutorial on how to work the graphics output.
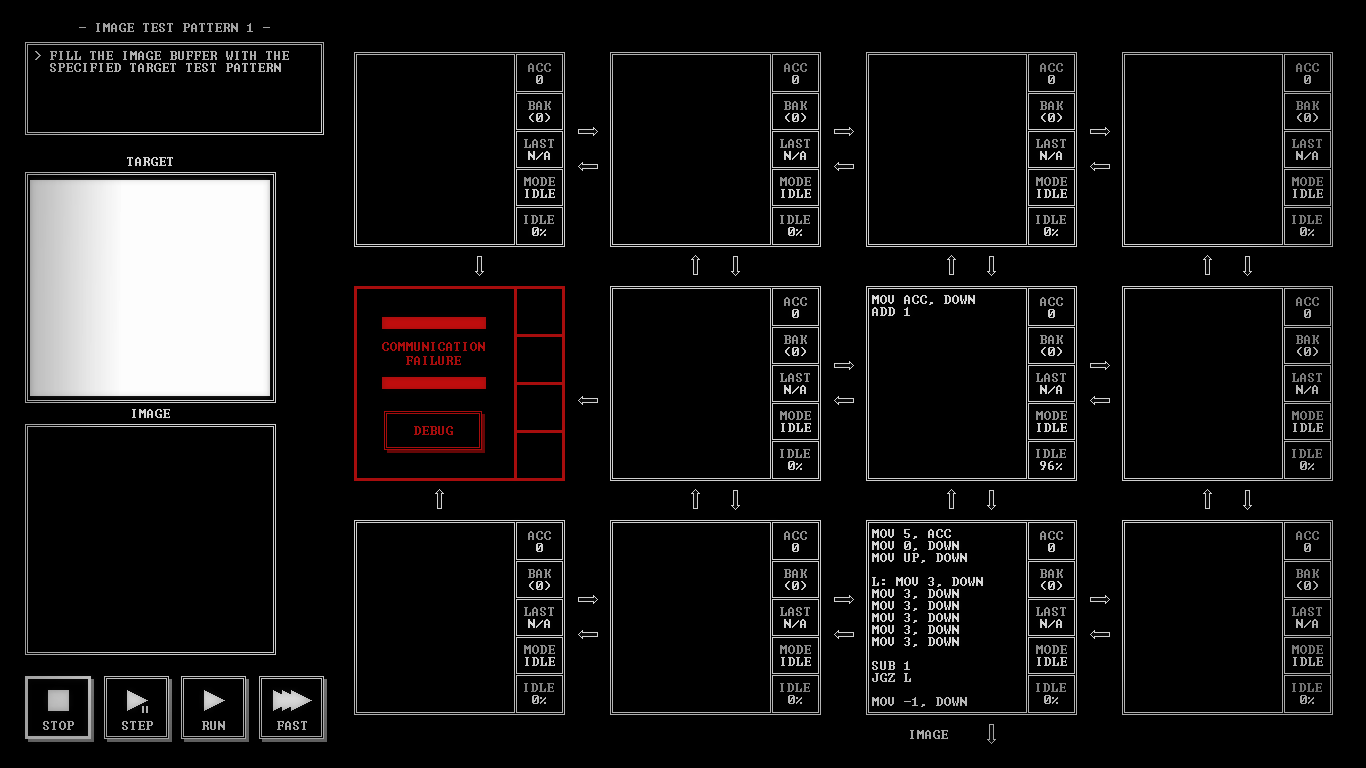
The top node keeps track of the Y position, while the bottom node loops over the X axis and outputs the color value for white 30 times. I initially used to simply loop 30 times for this, but then I realized that you could trivially get a much more efficient solution by unrolling this loop. The resulting program is about twice as easy on the ol' cycles.
Segment 51781: image test pattern 2
Just in case you hadn't figured out how the image output works yet, here's another tutorial-like puzzle for you.
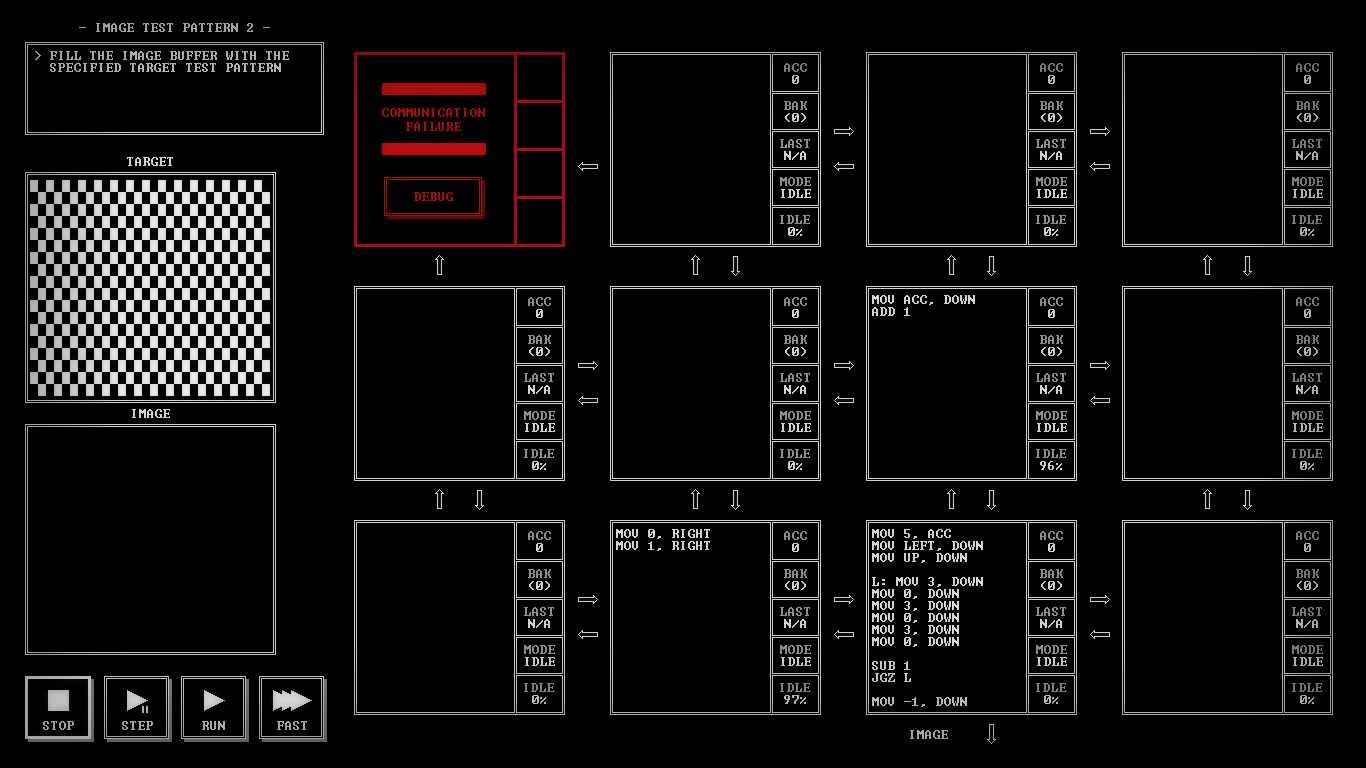
It's pretty much identical to the previous one. The main twist is that the lines alternate in what color they start with. We can cheat our way around this problem by abusing the fact that the default color of the image is black, meaning we don't actually have to explicitly draw the black squares. So in my solution, I'm drawing the same white/black checkered line every time, but I'm alternating on what X position I'm starting this line at.
Segment 52544: exposure mask viewer
Now things are getting interesting. This and the next puzzle are my favorites in the game. Challenging, but not unfairly difficult, and very rewarding to watch run after you've solved them.
Forget the simple lines from the previous two puzzles, in this one we suddenly have to be able to draw arbitrarily-sized rectangles anywhere on the screen. As you can see, this is the first puzzle I've used comments in any significant way, because there's just too many different variables to keep track of. The general idea is to decompose each rectangle as H lines of width W, and draw them as such.
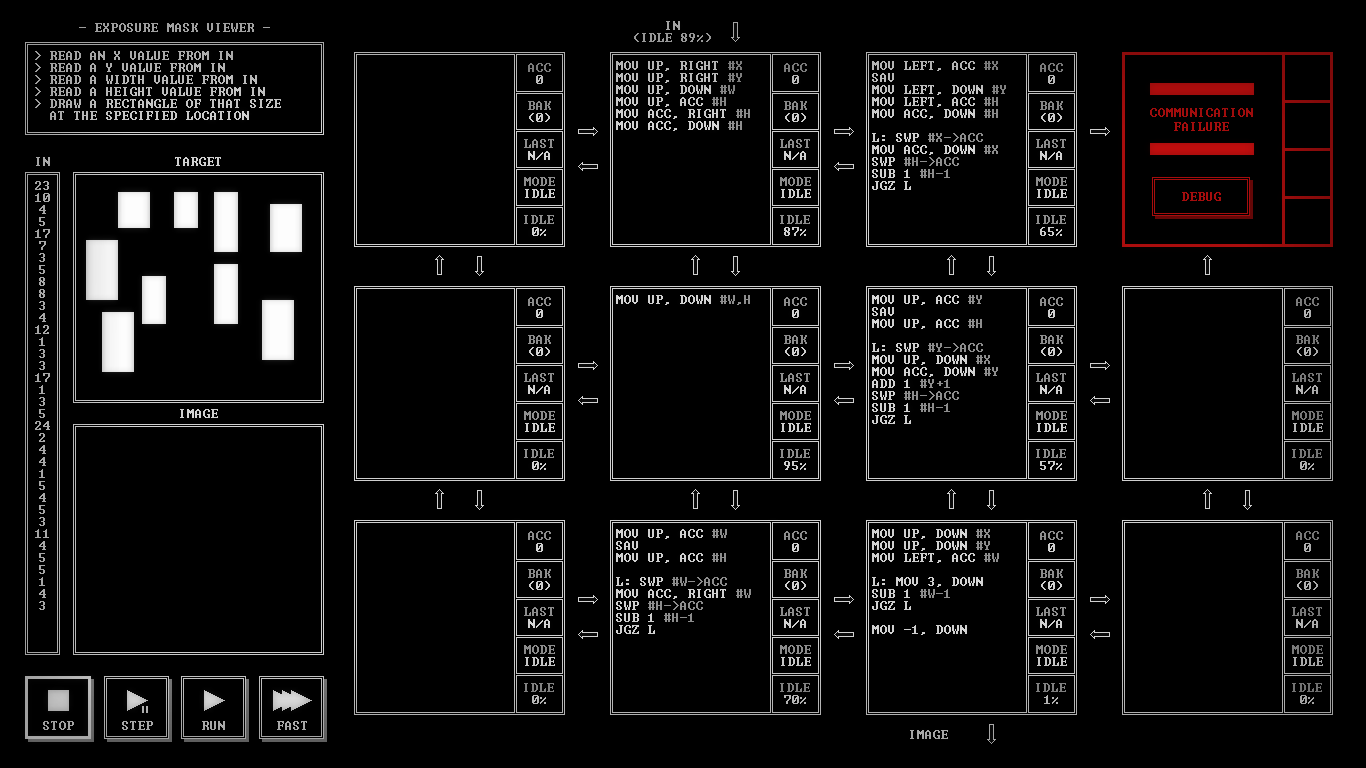
Here's how the nodes come together to achieve this:
Nodes 1 and 3 simply pass variables around to other nodes that need them.
Nodes 2 and 4 do very similar things, and are responsible for passing the X and Y values for the next line to be drawn down to node 6. They do this H times (as each rectangle consists of H lines), and thus keep track of H as well as X (in the case of node 2) and Y (in the case of node 4). Node 4 also increments Y by 1 after each line is drawn; the X value for a rectangle's line never changes.
Node 5 keeps track of the width value W, and passes it to node 6 when needed. It also does this H times, as H lines will be drawn.
Node 6 does the actual drawing. It receives the X and Y values for the line it's going to draw from node 4. It then receives the width of the line from node 5, and loops to draw that many pixels. Note that node 6 doesn't actually know anything about the rectangle it's drawing; it only receives instructions for drawing single lines. The coordination between the other nodes is what actually ends up drawing the rectangle.
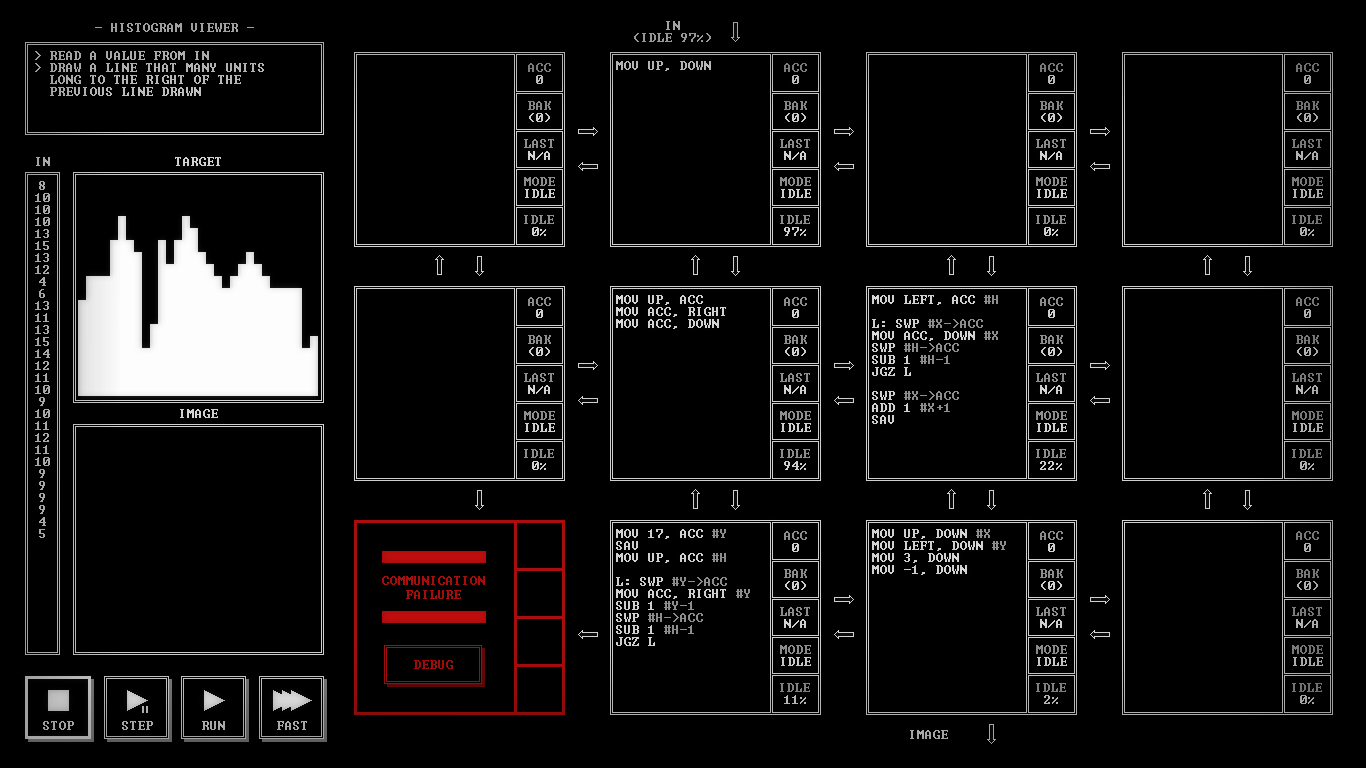
Segment 53897: histogram viewer
Similar to the previous puzzle, this one was also a lot of fun to solve.
Node 3 keeps track of the current X value, and passes it down to node 5, H times. After a bar has been drawn, the X value is incremented by 1 for the next bar.
Node 4 is responsible for the Y value, which it computes by counting back from 17, H times.
Node 5 simply draws a single pixel at the (X, Y) values given to it by nodes 3 and 4.